
Our Work
As a business owner, I take great pride in every step of our process - from data collection to analysis to reporting. My grandfather was a proud carpenter whose motto, Inspect My Previous Work, spoke to his deep commitment to quality. His legacy left a lasting impression on me and that same commitment to quality guides my work today. I invite you to inspect some of my previous work, shared below with permission from my clients.


Reports
Reporting is central to our work. Explore a few of our recent reports below:
Medical Transportation Assessment - Faribault and Martin Counties
Wells Area Food Shelf Case Study - a report for Faribault, Martin and Watonwan County SHIP
Fairmont and St. James Bike Share Case Study- a report for Faribault, Martin and Watonwan County SHIP
Opioid Settlement Funds Summary Report to Faribault County Commissioners and Martin County Commissioners
Presentations
Liz is invited frequently to present at public health and related conferences. Below are a few past presentations.
HTAC Use Case
Liz is a super fan of Minnesota’s Health Trends Across Communities (HTAC) electronic health records data. In February 2025, she was invited to present to the Association of Minnesota Counties about her work with this rich data source. Her presentation, starting at 42:09, showcased a data analysis project she led with students in Minnesota State University, Mankato’s Allied Health Sciences Program as part of her work with the Collaborative for Rural Public Health Innovation.
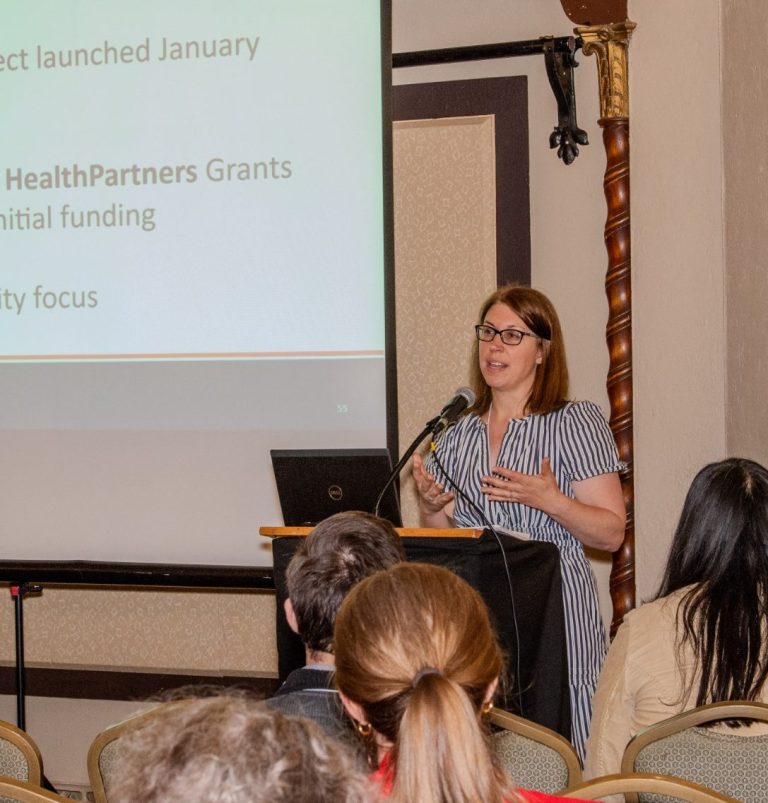
From Data to HOPE
In May 2025, Liz was invited to present at the Minnesota Public Health Association conference with her colleagues Maria Bonilla and Alex Calero. Their presentation highlighted Washington County’s HOPE Project, an initiative designed to support residents at greatest risk for poor health outcomes. They shared how Washington County used data to launch the project and how county staff have supported community-led HOPE efforts.
NorthStar Data Tip
In this video, Liz explains how to create dropdown lists in Excel and color code them using Data Validation and Conditional Formatting. This technique is helpful for quickly visualizing your results.